DATA ANALYST • BUSINESS INTELLIGENCE ANALYST

Transforming Data Into Business Decisions

I design dashboards, analyse data and build business intelligence solutions using Python, SQL, Excel and Power BI to help organisations make better decisions through data.

Sylvia Njagi

About Me

I am a Data Analyst and Business Intelligence Analyst passionate about transforming raw data into actionable business insights. My work combines analytics, storytelling, and dashboard design to help organisations make informed decisions.

I have experience using Python, SQL, Power BI, Excel, Power Query, DAX, and GitHub to clean, analyse, visualise and communicate data. My interests include business intelligence, education analytics, climate analytics, and policy-focused data projects.

Having grown up in Kenya, I'm especially drawn to projects like CBC transition readiness and school safety analysis, where data can directly inform decisions that affect students and communities I understand firsthand.

Technical Skills

Python SQL Power BI Excel Power Query DAX Pandas NumPy Matplotlib Git GitHub Business Intelligence Dashboard Development Data Visualisation Data Cleaning

Featured Analytics Projects

These projects demonstrate my experience in business intelligence, dashboard development, data analysis and analytics storytelling.

Food Business Intelligence Dashboard

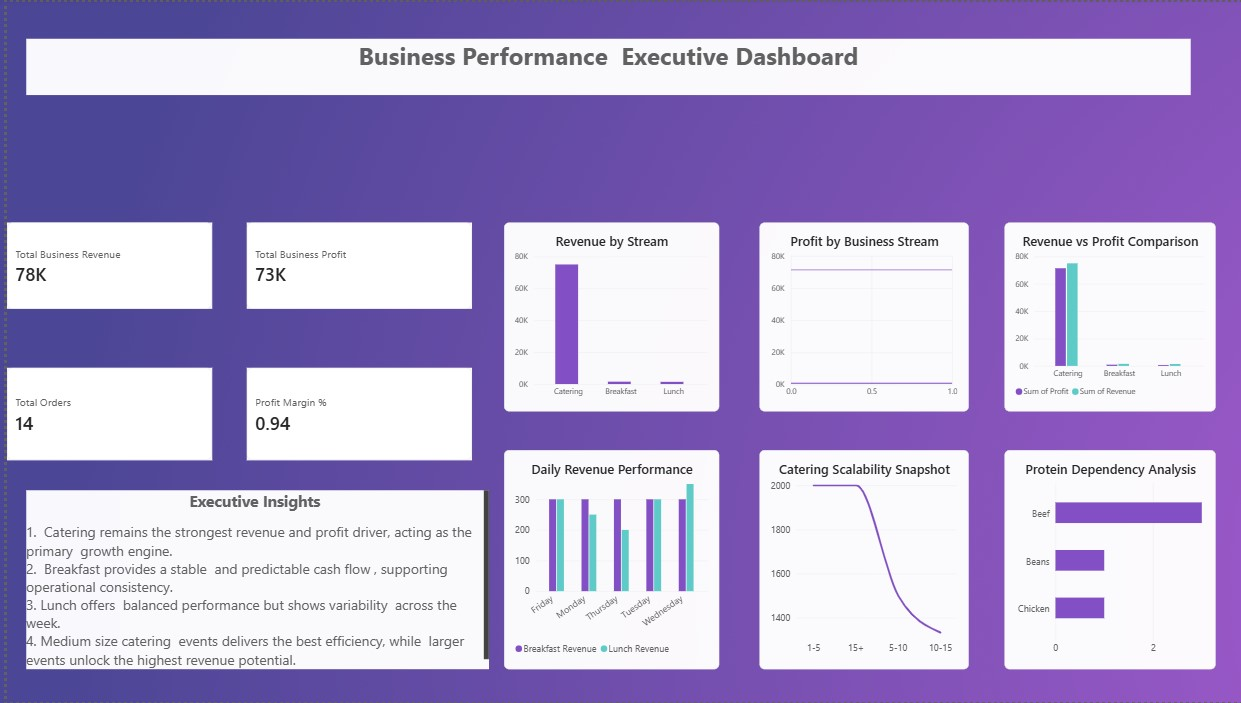
Food Business Intelligence Analytics

Built an interactive Power BI dashboard to analyse sales, profitability, customer trends and operational performance, providing insights that support strategic business decisions.

Key insight: Catering profit scaled from KES 9,100 to KES 29,100 by group size, while breakfast held flat pricing for the most consistent daily cash flow.

Tools: Power BI • DAX • Power Query • Excel

View Project → GitHub Repo ↗
Education Crisis Dashboard - Python Analysis

Education Crisis in Kenya

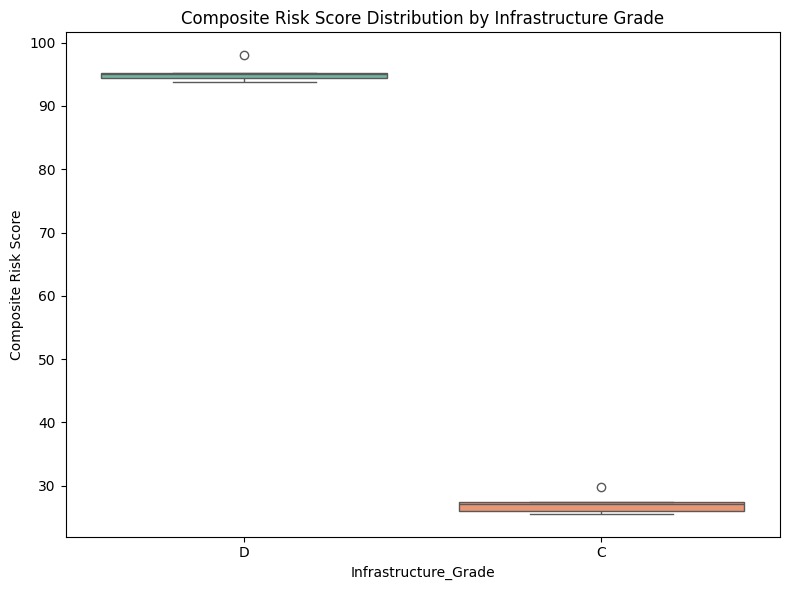
Analysed education challenges affecting learning outcomes, school readiness and resource distribution using Python and interactive visualisations to support evidence-based policy.

Key insight: Overcrowding correlates with unrest risk at r = 0.94 — the 5 highest-risk counties average 95/100 on the composite risk score vs 27 for the rest.

Tools: Python • Pandas • Power BI

View Project → GitHub Repo ↗
G7 Climate Dashboard - Python Analysis

Do G7 Climate Commitments Match Reality?

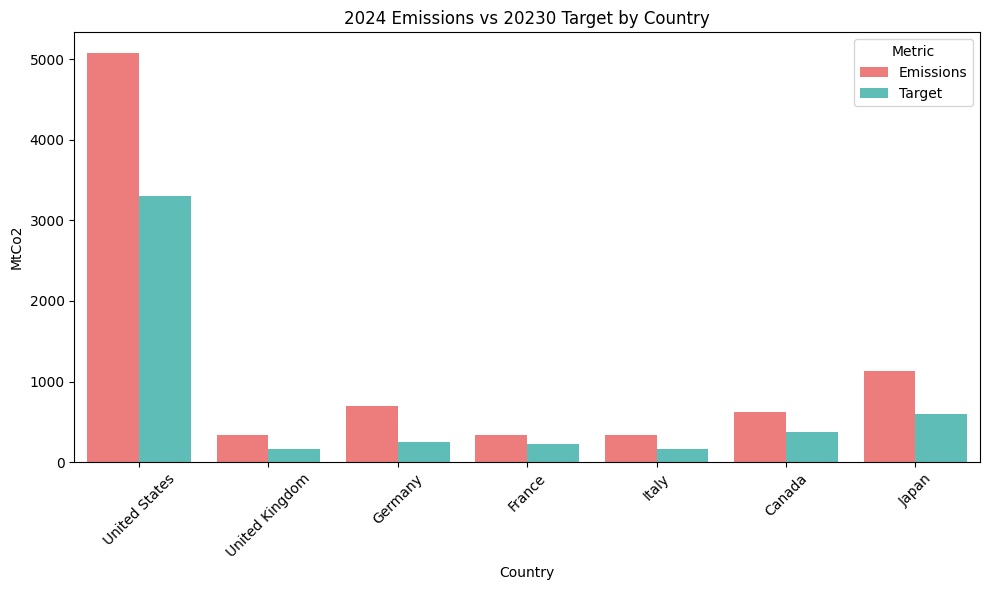
Investigated whether G7 countries are meeting climate commitments through emissions analysis, policy comparison and data visualisation using Python.

Key insight: No G7 country is on track for its 2030 target — the UK leads with a 26.1% cut, while Canada's emissions rose 6.5%.

Tools: Python • Pandas • Matplotlib

View Project → GitHub Repo ↗
CBC Transition Dashboard - Python Analysis

CBC Transition Readiness Analysis

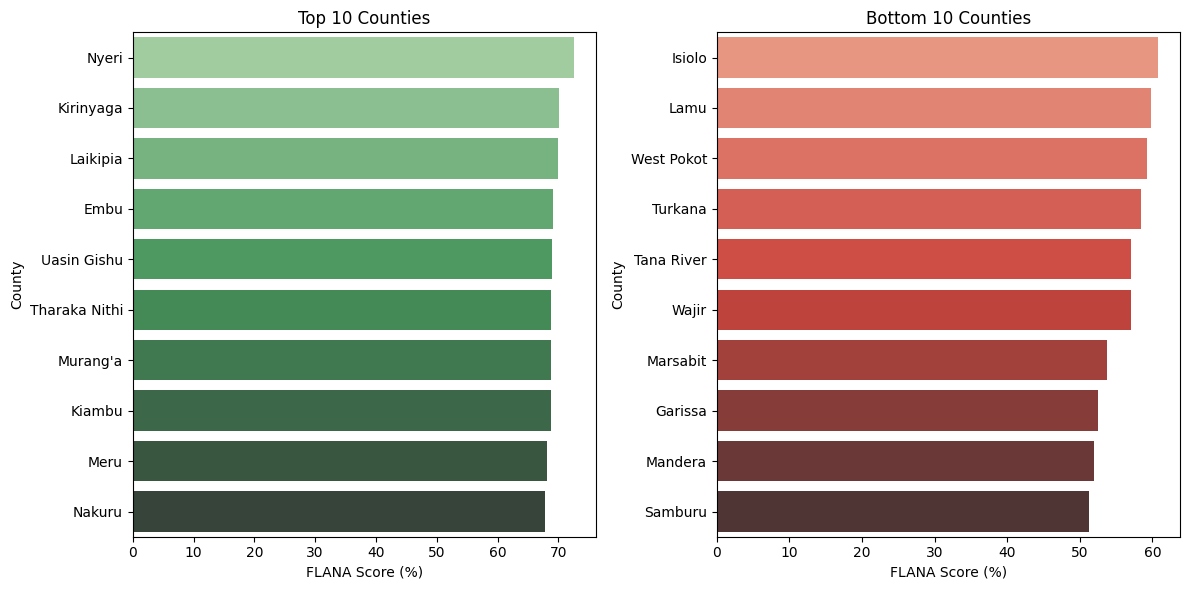
Evaluated county-level readiness for Kenya's Competency-Based Curriculum by analysing infrastructure, teacher preparedness and education resources.

Key insight: ASAL counties average 10 points lower on readiness than the rest of Kenya, and all 10 face both severe teacher shortages and very low digital access.

Tools: Python • Pandas • Data Analysis

View Project → GitHub Repo ↗

Let's Connect

I'm always interested in discussing data analytics, business intelligence, and opportunities where data can drive better decisions.